I got a $134 Cloudflare D1 bill. Here's how I cut it 95%
- Published
- Updated
On this page
- The backstory
- What 127 billion row reads means
- The amplification problem
- Fix 1: composite indexes via Drizzle
- Fix 2: ANALYZE (the planner gotcha)
- Fix 3: a KV cache for nav data
- Fix 4: generalize the pattern
- Before and after, on remote D1
- How D1 charges, and why this bites SQLite users harder
- Three things I'd tell past-me
- FAQ
- Wrapping up
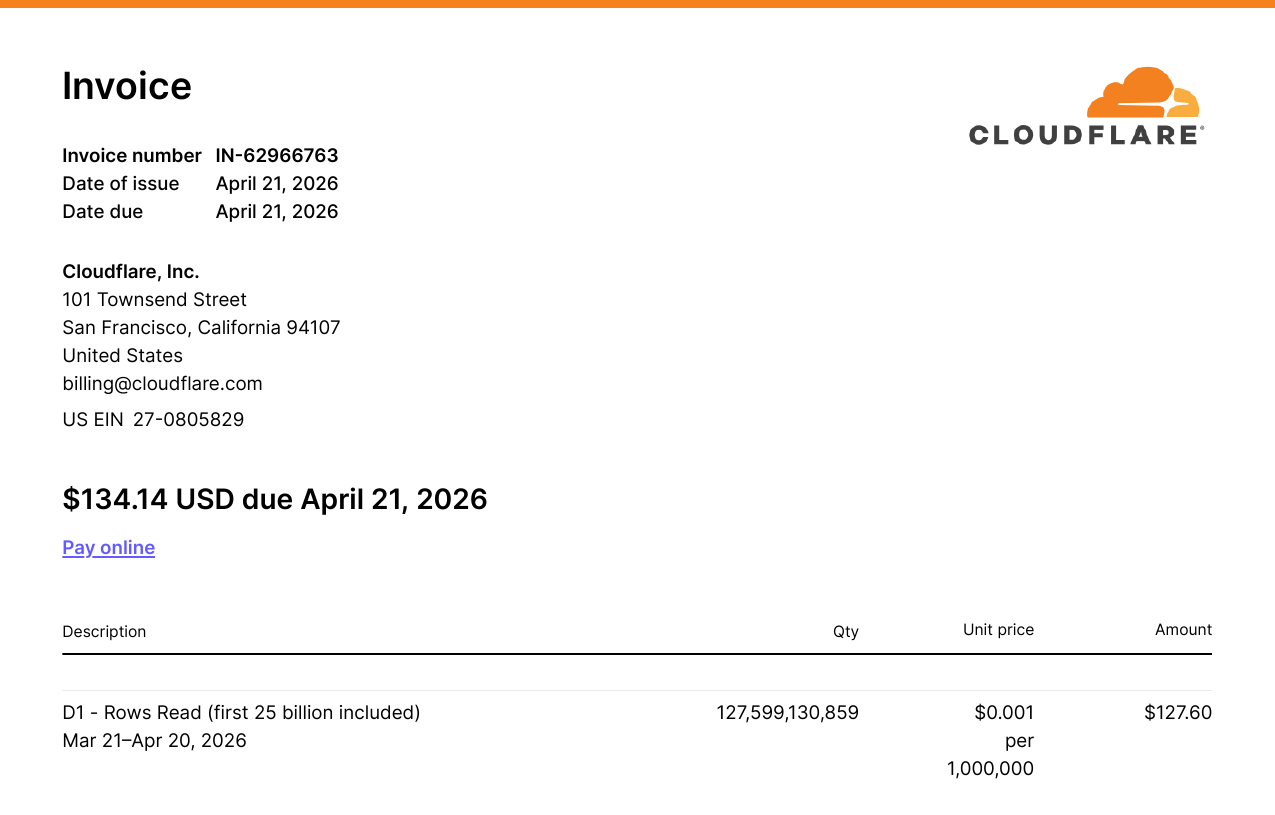
On April 21, 2026, my Cloudflare invoice was $134.14. Most of my bills had been a buck or two, barely above free-tier, for months.
When I opened the breakdown, $127.60 of it (95%) came from a single line item: 127,599,130,859 D1 row reads. 127.6 billion. On a database with 765,000 rows.
This is the post-mortem on Cloudflare D1 pricing. It's also the playbook for fixing it: composite indexes, ANALYZE, and a KV cache layer that ended up wrapping every read-heavy route on the site.
The backstory
Two months earlier, in February, the HHS DOGE team had open-sourced the largest Medicaid dataset in the department's history: provider-level claim aggregates per billing code per state per year. The tweet announcing it pulled 50.7 million views.
I was vacationing in Kuala Lumpur, jetlagged, and saw the tweet that night. I downloaded the dataset, cleaned it, and scaffolded a project: whatmedicaidpays.com, a public site where anyone can look up what Medicaid pays for any procedure code in any state. Stack: SvelteKit on Cloudflare Workers, D1 as the database, Drizzle as the ORM.
I shipped it the next day, did some link-building, watched the traffic come in, and moved on.
Then the bill arrived.
What 127 billion row reads means
D1 doesn't bill on storage or queries. It bills on rows read. Every row that the SQLite engine scans to satisfy your query, whether it returns it or not. If your query does a full table scan and the table has a million rows, you get charged for a million row reads.
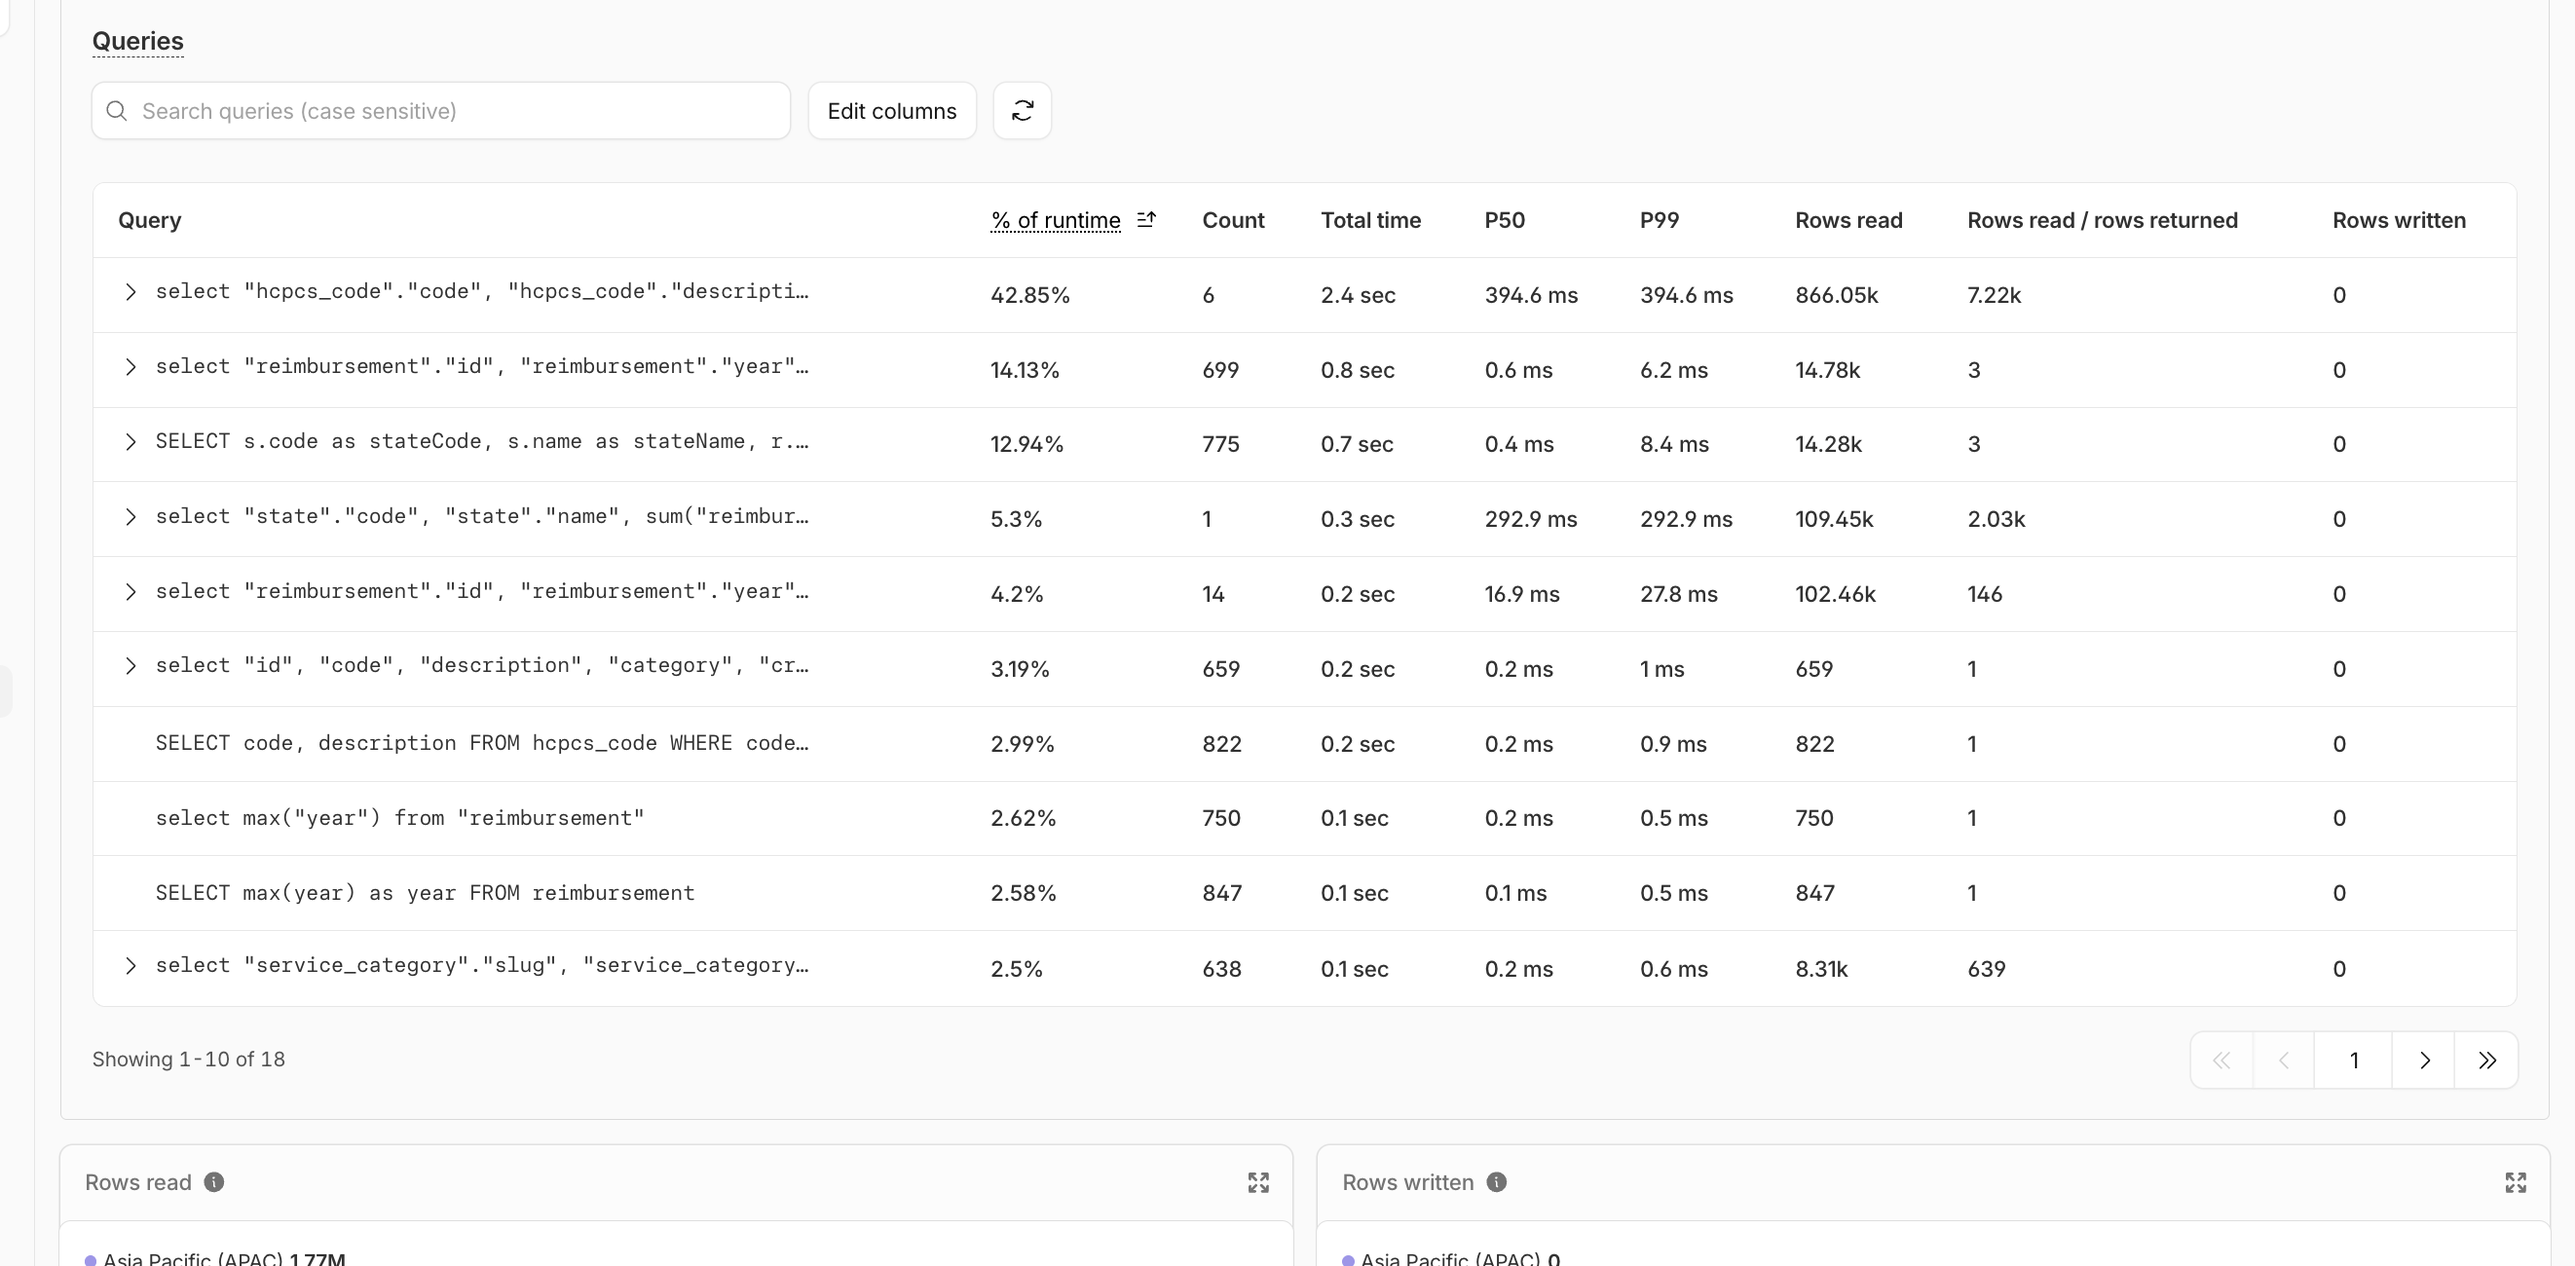
When I pulled the per-query breakdown from D1 analytics (the dashboard plus wrangler d1 insights, which sorts queries by avgRowsRead or queryEfficiency), four queries were responsible for 93% of the total reads:
select max(year) from reimbursement(getLatestYear()) — finds the most recent year of data, used to default the year picker on every page. 225,873 calls, 172.86 billion rows read.Top-procedures aggregation (
getTopHcpcsCodes()) — group by HCPCS code, sumtotalClaims, order desc, limit 8. Powers the nav dropdown and the homepage hero. 123,325 calls, 122.21 billion rows read.Procedure-by-code-and-year (
getReimbursementsByCode()) — joins the reimbursement, state, and HCPCS code tables to pull every state's pricing for one procedure in one year. Renders the/compare/[code]and/procedure/[code]pages. ~89,000 calls, 68.68 billion rows read.State stats and rankings (
getAllStatesProcedureCounts(),getStateReimbursementStats()) — count distinct procedures per state and per-state aggregates for the map explorer and state pages. ~20 billion rows read.
That select max(year) line is special. The function calling it is getLatestYear(). It runs on every page load. The layout uses it to figure out which year of data to show, and for each call, the database scans all 765,283 rows of the reimbursement table to find one number.
The reimbursement table had zero indexes beyond the primary key. Every hot query was a full table scan. Most queries had a rows_read / rows_returned ratio in the hundreds of thousands.
The amplification problem
The damage gets worse than "no indexes". getNavData() runs on every single page load via +layout.svelte. Inside it, two functions get called: getLatestYear() and getTopHcpcsCodes(). Each one scans the full table. Every visitor, every page, two full scans before the page-specific data even loads.
Every code page (/compare/99213, and so on) was paying for the layout's two scans, plus its own.
Fix 1: composite indexes via Drizzle
The fix here is the boring, correct one. Add indexes on the columns the hot queries filter and group by.
// src/lib/server/db/schema.ts
export const reimbursement = sqliteTable(
	'reimbursement',
	{
		// ...columns
	},
	(table) => [
		index('reimbursement_year_idx').on(table.year),
		index('reimbursement_year_hcpcs_idx').on(table.year, table.hcpcsCodeId),
		index('reimbursement_year_state_idx').on(table.year, table.stateId),
		index('reimbursement_state_hcpcs_idx').on(table.stateId, table.hcpcsCodeId)
	]
);
The composites cover the join + group-by patterns the app actually uses: "top procedures in year X" wants (year, hcpcsCodeId); "stats for state X in year Y" wants (year, stateId); the procedure-by-code-and-year query is best served by either composite that leads with year.
Generating the migration with Atlas (bun run atlas:diff) also flagged pre-existing schema drift on an unrelated table. Generated migrations are diffs, not commands; read them. I trimmed the SQL to just the four CREATE INDEX statements and applied that.
bunx wrangler d1 execute whatmedicaidpays --remote \
	--file ./drizzle/migrations/<timestamp>_add_indexes.sql
Four indexes. 4.3 seconds.
Fix 2: ANALYZE (the planner gotcha)
I re-ran the same queries on remote D1 and re-checked the dashboard. Most queries had collapsed:
max(year): 765,283 rows → 1 row (a 765,283× reduction, served by a covering index)Procedure-by-code-and-year: 765,392 rows → 164 rows (a 4,667× reduction)
But the top-procedures aggregation only went from ~1 million rows to ~352,000 — a 2.8× improvement, which is bad relative to the others.
I EXPLAIN QUERY PLAN-ed it. SQLite was using reimbursement_year_state_idx for the year filter, then building a temp B-tree to do the GROUP BY by hcpcsCodeId. There was a better index sitting right there: reimbursement_year_hcpcs_idx, which would have served the GROUP BY directly.
The planner was guessing wrong because it had no statistics. SQLite's query planner uses a built-in table called sqlite_stat1 to choose between indexes; when that table is empty, it falls back to heuristics that can pick badly when several indexes overlap.
ANALYZE;
That's the whole fix. After running it, the same query dropped to 150,572 rows. Another 2.3× win on top of the indexes. The temp B-tree was gone, and the planner walked the right index from the start.
Cloudflare specifically recommends PRAGMA optimize as the canonical wrapper. It runs ANALYZE under the hood and is safe to run repeatedly. See the D1 use-indexes guide for the full pattern.
If you've added indexes on a D1 database that already has data, run ANALYZE (or PRAGMA optimize). Otherwise the planner can leave performance on the table for queries with multiple candidate indexes.
Fix 3: a KV cache for nav data
After the indexes and ANALYZE, the dashboard math still wasn't great. getTopHcpcsCodes({ year, limit: 8 }) was reading ~150,000 rows per call. That's down from 8 million, but the function still runs on every page load, on every route. At ~123,000 monthly pageviews, that one function alone was projected to read ~18.5 billion rows a month.
The data this function returns changes once a year, when the CMS reingests new HHS data. It's the same answer for every visitor, on every page. That's the textbook profile for a cache.
I created a Cloudflare KV namespace and bound it to the worker:
# wrangler.toml
[[kv_namespaces]]
binding = "WHATMEDICAIDSPAY_CACHE"
id = "<your-kv-namespace-id>"
Then wrapped the nav function in cache-aside:
// src/lib/remote-functions/nav.remote.ts
import { CACHE_KEYS } from './cache-keys';

export const getNavData = query(async () => {
	const cached = await env.WHATMEDICAIDSPAY_CACHE.get(CACHE_KEYS.nav, 'json');
	if (cached) return cached as NavData;

	const fresh = await loadNavDataFromDb();
	await env.WHATMEDICAIDSPAY_CACHE.put(CACHE_KEYS.nav, JSON.stringify(fresh));
	return fresh;
});
No TTL. I deliberately don't expire this. The CMS fires a manual invalidation when new data lands; if I let TTL handle it I'd get inconsistent renders during the hour after re-ingest. Manual invalidation is one wrangler command:
bunx wrangler kv key delete --binding=WHATMEDICAIDSPAY_CACHE nav-data:v1
Fix 4: generalize the pattern
The nav fix was the headline win, but I had four other read-heavy routes doing the same kind of work (querying expensive aggregates that change once a year), and the same fix applies to all of them.
I extended the cache-aside pattern to:
home.remote.ts— homepage data (home-data:v1)map-explorer.remote.ts— the state-by-state map (map-explorer-data:v1and per-codemap-explorer-data-by-code:v1:{CODE})compare.remote.ts— the/compare/[code]pages, one cache entry per code (compare-data:v1:{CODE})search.remote.ts— empty-query results and per-query caching (search-empty:v1,search-query:v1:{q})
Same pattern, different keys. I pulled the keys into a single file so invalidation has one source of truth:
// src/lib/remote-functions/cache-keys.ts
export const CACHE_KEYS = {
	nav: 'nav-data:v1',
	home: 'home-data:v1',
	mapExplorer: 'map-explorer-data:v1',
	mapExplorerByCode: (code: string) => `map-explorer-data-by-code:v1:${code}`,
	compareByCode: (code: string) => `compare-data:v1:${code}`,
	searchEmpty: 'search-empty:v1',
	searchQuery: (q: string) => `search-query:v1:${q}`
} as const;
The version suffix (:v1) is there so I can change the cached shape later without writing migration code. New shape, new version, old keys naturally fall out.
Before and after, on remote D1
Numbers from the actual remote database, measured before and after each step:
select max(year) from reimbursement: 765,283 rows / 141ms → 1 row / 0.17ms (765,283×, served by a covering index)Top-procedures aggregation: 1,002,963 rows / 450ms → 352,880 rows after indexes → 150,572 rows / 556ms after ANALYZE (6.7×)
Procedure-by-code-and-year: 765,392 rows / 128ms → 164 rows / 1.04ms (4,667×)
Projected over 30 days: ~400 billion rows → ~19 billion rows. About a 95% reduction from indexes alone.
After the KV layer landed, the picture flattened entirely. KV inspection a few hours after deploy showed twelve keys populated: eight compare-data:v1:* entries (one per code that had been visited), plus nav, home, map-explorer, and search-empty. The 1-hour D1 dashboard showed the previously-dominant queries flat-lining at near-zero. Every D1 hit during that window was a first-ever visit to an uncached /compare/[code] URL. One D1 hit per unique code, ever.
How D1 charges, and why this bites SQLite users harder
If you're coming from Postgres or MySQL, D1's pricing model is going to surprise you on the down-side.
In a traditional RDBMS, an unindexed query on a million-row table is slow but not directly billed. You feel the pain through latency and CPU pressure on your server. With D1, every row the engine touches shows up on your invoice. A missing index isn't just slow. It's a line item on your invoice.
The current D1 pricing charges $0.001 per million rows read on the Workers Paid plan, with 25 billion rows included per month. My 127.6 billion translates cleanly: (127,599,130,859 − 25,000,000,000) ÷ 1,000,000 × $0.001 = $102.60 in row-read overage, plus the underlying paid-tier line items that round it up to the $127.60 figure. The math is exact.
The flip side: when you do have your indexes right, D1 is exceptionally cheap. A point lookup against an indexed column reads 1–5 rows. You can serve a lot of traffic for very little money. The pricing model rewards you for getting database hygiene right and punishes you for skipping it.
Three things I'd tell past-me
Add indexes before you ship, even on a weekend project. The mental model "indexes are an optimization" is wrong on a row-billed database. They are table stakes. If a query filters or groups by a column, that column needs an index. Same day, same commit.
Run ANALYZE after every batch of index changes. It's free, it takes one second, and you avoid the planner-misstep class of problems entirely.
If a function runs on every page load, cache it before it ships. Layout-level data should never be coming straight from your database on a worker-billed platform. Cache on day one and invalidate when the data actually changes.
FAQ
Wrapping up
The full bill (indexes, ANALYZE, KV) collapsed a $134 month into something I'd be embarrassed to talk about. The mental model that took me a month and one painful invoice to internalize: on a row-billed database, your performance is your bill, and your bill is your performance. Profile early, index aggressively, cache the layout-level reads.
If you're building on the same stack, my SvelteKit + SQLite + Drizzle guide is the prerequisite for most of the schema and migration code in this post. It's the post I'd start from if I were doing this again from scratch.
Happy coding!